

Fleet risk data: from reporting to retention
06 October 2026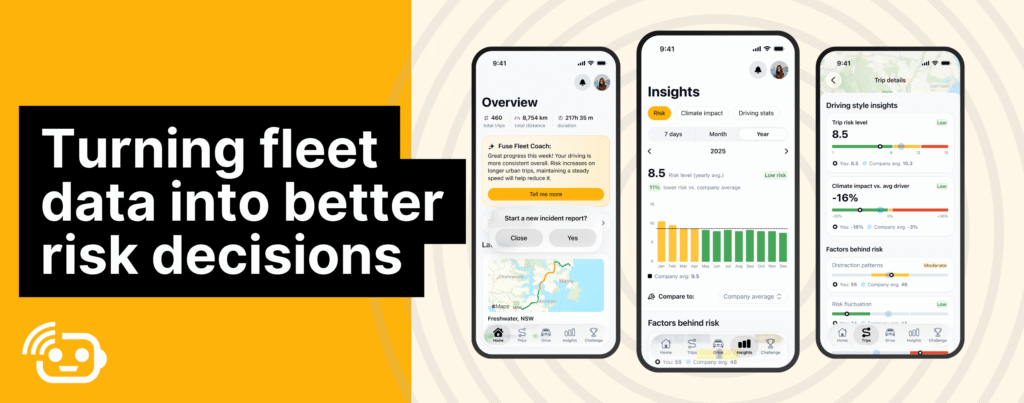
By Simon Donovan | Executive General Manager, Sales and Distribution of Fuse Fleet and contribution by Piet Strauss, Insurance Adviser | Austbrokers Comsure, Qld
The Fuse Fleet Drive app is live
The Fuse Fleet Drive app is here. The new app replaces the current Fuse Fleet app and gives your customers a sharper way to drive down risk.
Existing users simply download Fuse Fleet Drive, sign in and their details and driving history carry over, so setup takes minutes. New users download the app, create an account and enter their company code, which we provide.
The app brings Fuse Fleet Coach, with personalised insights after every trip, alongside crash risk identification with real-time trip tracking and company challenges including a live leaderboard. Claims now take about two minutes to report and lodging a claim within 24 hours can help reduce the incurred costs of a claim. The design and performance are sharper throughout.
Every trip your customers drive feeds one thing, and that is your reporting. The app collects and the Crash Probability Hub reports. There is more on the Hub below.
The move is ours to manage, so we do the heavy lifting. We build you a bespoke roll-out pack, hand your customers everything they need to make the switch and track adoption as they come across. Easy for you and easy for them.
From reporting to retention
Large fleets are changing how they think about risk. We watched this begin in the rental sector.
Over years, some of Australia’s larger rental fleets moved from traditional programmes with $1,000 or $2,000 excesses to structures where they retain $10,000, $15,000, $20,000 or more of each loss.
The shift did not come from raising the excess. The change came because these fleets understood their own risk. They built stronger claims processes, improved recoveries, used their data and invested in driver and vehicle risk management. They grew comfortable retaining predictable losses rather than paying an insurer to carry every dollar.
Larger commercial fleets face the same opportunity. Across general motor fleets, from several hundred vehicles to several thousand, we still see low excess structures. For some businesses, low excess is the right call. For others, low excess means paying to transfer losses the business is equipped to retain and manage.
Higher self-retention needs more than a bigger excess. Claims management matters. Driver selection matters. Recovery processes matter. You need to read the fleet data and act on the findings. Management needs visibility over the true cost of incidents. A safety culture needs to be real, not stated.
How fleet risk data supports better risk decisions
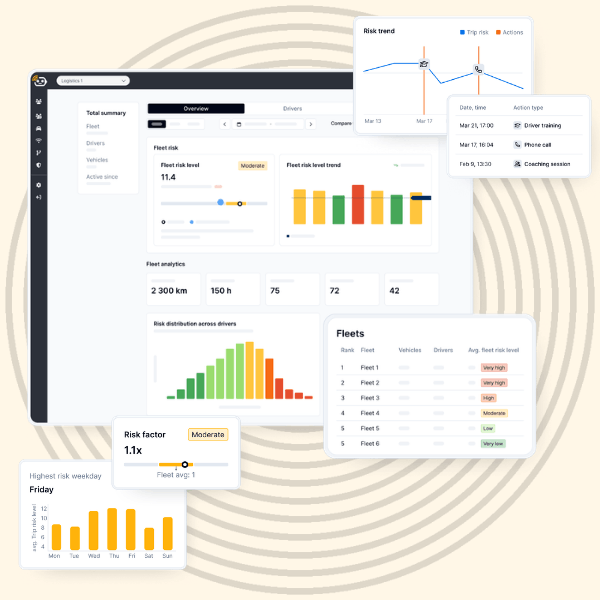
This is where reporting earns its place. The Fuse Fleet Drive app and Crash Probability Hub give you this visibility. You see fleet risk at a glance, risk trending over time and the effect of every intervention. The Hub surfaces the few drivers carrying most of your risk, lets you coach them with data behind the advice and logs each action so you can measure what works.
The bigger conversation moves past the price of the motor policy. A single accident reaches CTP, workers compensation, employee injury, replacement vehicles, downtime, lost productivity and admin. For a large fleet, those costs add up. Most fleets ask, what are we paying for fleet insurance? The better question is, what is our fleet risk costing us in full?
Once a business measures total cost of risk, risk management changes shape. Reduce accident frequency and you reduce cost across the whole business, not the motor premium alone.
CRI has worked with rental fleets through this journey for years. Fuse Fleet brings the same thinking to the broader commercial market. For brokers with customers running hundreds or thousands of vehicles, we want to do more than quote. We want to understand where the money goes, help customers understand their loss profile and consider appropriate approaches to risk retention and transfer. We look at what the structure should be in two or three years, not only at the next renewal.
For sophisticated fleets, the saving rarely comes from price. The saving comes from changing how risk is understood, managed, retained and transferred. We saw this journey in rental. Many large Australian fleets are ready to take the same one.
Talk to the Fuse Fleet and CRI team about the next stage of your customer’s fleet risk strategy.
A broker’s view on fleet risk data

For a broker’s view on fleet data, we spoke with Piet Strauss at Austbrokers Comsure, which brings together five long-standing Queensland and New South Wales brokerages, with more than 40 years of advice and risk management under one roof.
Pictured: Piet Strauss, Insurance Adviser | Austbrokers Comsure, Qld
Piet works with business customers across the south-east, motor and transport risk among them. We asked him three key questions about his customers.
Q1. Where do fleet customers underestimate the true cost of an incident?
Most customers see the repair bill first, but that is only part of the cost. There can also be vehicle downtime, replacement costs, lost productivity, administration, employee impacts and disruption to the business. When you put those costs together, the value of preventing an incident becomes much clearer.
Q2. How does driver-level risk data strengthen a broker’s position at renewal?
It gives you evidence rather than assumptions. You can show where the risk sits within the fleet, which drivers have been identified, what action the customer has taken and whether that action has improved the result. That gives the underwriter a much stronger picture of how the fleet is being managed and gives the broker a better renewal story.
Q3. What determines whether a fleet risk tool actually gets used?
It has to be simple to introduce and useful from the start. If drivers can get set up quickly, managers can see meaningful information and the broker can use that data with the customer, adoption is much easier. The best risk tool is one that becomes part of how the fleet is managed rather than another system people stop using after a few weeks.
Crash Probability Hub
The reporting behind your next fleet renewal.
The Fuse Fleet Drive app collects and the Crash Probability Hub reports. Every trip becomes fleet risk data. You read it, act on it and take it to a renewal.
Risk from portfolio to trip
- Track risk from portfolio level down to fleet, driver and trip.
- Watch risk trend over time, so you see whether it is rising or falling.
- Rank every fleet and driver from high to low, so you know where to look first.
- Benchmark a fleet against portfolio and world averages.
Find the drivers who matter
- Surface the drivers lifting your customers’ risk.
- The Hub flags drivers whose risk sits well above the fleet average, so you can act early.
- See the exposure and behaviour behind each score, from distraction patterns to speed management.
Know why and what to fix
- Fuse Fleet Coach shows why a driver or trip is high risk.
- The Coach names the behaviour to change and the time risk peaks.
- Drivers get clear feedback and managers get the reason behind each score.
Prove the change
- Log coaching, calls and training against the driver.
- Measure risk before and after every action.
- Walk into a renewal with an evidence-led story for the C-suite.